Method
I am writing this as a lab notebook — paper trading only. Not financial advice.
I tried to build a desk
I wanted a machine that could think like a trading desk: regime calls, fat market snapshots, an LLM proposing BUY/SELL/HOLD, a thick risk layer, options ladders, even weekly model-written postmortems.
I built that. It looked impressive on a diagram.
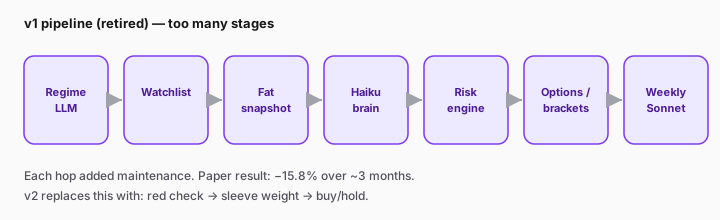
I ended up here
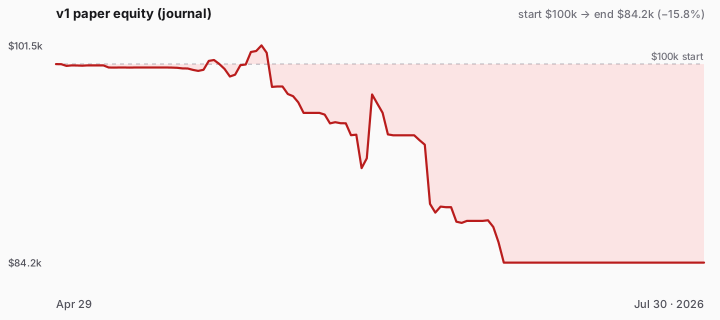
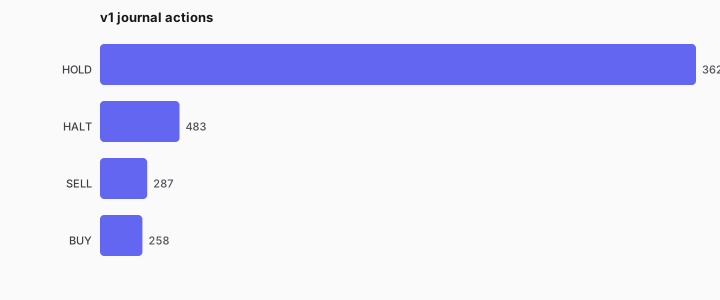
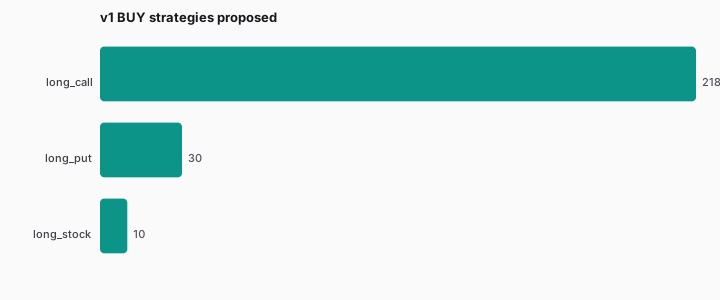
On paper, from Apr 29 to Jul 30, 2026, I watched $100k become $84,195 (−15.8%). Peak briefly cleared ~$101.6k. Max drawdown was about 17%. Thousands of cycles, mostly HOLD/HALT, and when I did buy it was usually long calls under an aggressive options profile.
I do not treat the loss itself as the whole failure. The failure was complexity without a trustworthy edge — activity that felt smart, P&L I could not attribute, and ops cost I could feel. I never gave boring methods enough room: quality funds, buy weakness, hold.
I am starting here
I kept the same paper book (~$84k left — no fairy-tale reset). I stripped the LLM out of the loop. Now I scan quality ETFs twice a day. If a fund is red today and its sleeve is underweight, I buy a small slice and hold.
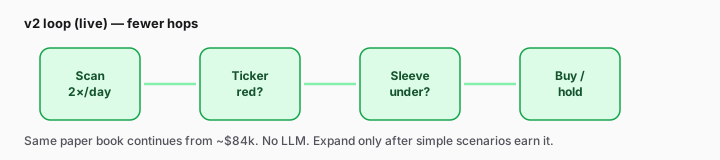
Details live on Architecture and Flow.
What I measure
I am keeping the scoreboard simple so I cannot kid myself:
- Paper equity vs the ~$84k starting line for v2
- Same-dollar S&P hold — buy SPY on day one and do nothing
- Drawdown from peak
- Buys placed (and whether I stick to one per sleeve per day)
- Sleeve weights vs the 50 / 25 / 25 targets
- Journal completeness — every scan leaves a receipt
If those numbers do not improve under a rule I can explain in one sentence, I do not get to add machinery.
I checked the scoreboard
Four weeks in — Jul 31 to Aug 28, 2026. I kept the leftover book. Last mark is about $85,180 against the $84,195 v2 line: +1.2%. Peak poked $85,735. Cash is $0. Twenty placed buys, seven holdings.
Sleeves vs the 50 / 25 / 25 targets: core ~44%, dividend ~26%, growth ~30%. I am a bit light on core and a bit heavy on growth. One alternate (SPLG) is not tradable on this paper account; I bought VOO / VTI instead.
The boring bar is the same dollars, day one, in SPY.
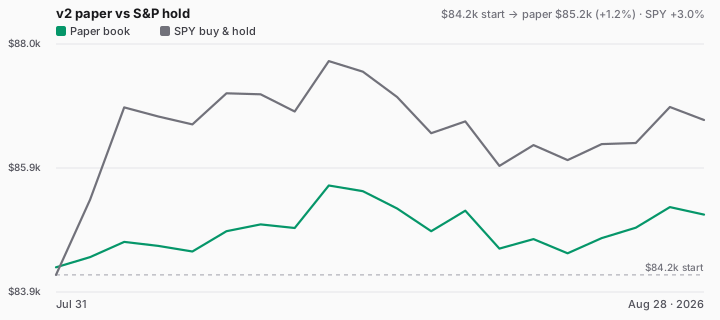
Live, that S&P hold is +3.0%. I am +1.2%. I spent early weeks with cash waiting for red days while the index ran.
I also ran the same rule in the backtester (paper mix, next-open fills, 5 bps, no year-end skim — does not touch the live book):
| Window | Red-day | S&P hold | vs S&P |
|---|---|---|---|
| Live (4 weeks) | +1.2% | +3.0% | −1.8 pts |
| 1 year | +22.3% | +37.8% | −15.5 pts |
| 3 years | +67.5% | +71.3% | −3.8 pts |
| ~6 years (incl. 2022) | +143.5% | +130.5% | +13.1 pts |
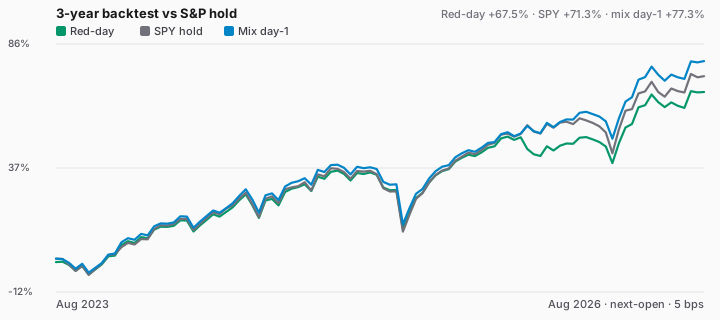
On the 1-year and 3-year windows, buying the mix on day one beat SPY (+42.2% and +77.3%). The red-day gap is not the ETFs. It is sitting in cash until something is red.
The ~6-year window is the exception: waiting for red days beat a day-one SPY hold, with a deeper max drawdown (~23%). QQQM was not listed at the 2020 open, so that mix is not a clean apples-to-apples.
I am not expanding the rule yet. This bull stretch has not earned it.
Where I hope to go
I want a MarI/O-style loop later: mutate simple rule variants, score them on paper fitness, keep winners. v2 is the seed that loop has to beat — I have not built the mutator yet.
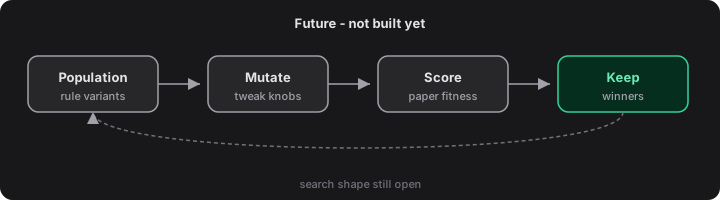
As I iterate from a boring baseline that I trust, I also want to learn the LLM aspect again — not as a day-one brain that places options, but as something I earn the right to reintroduce once the paper book and the fitness loop teach me what “better” looks like.